
Student Led Science: Testing the Waters
- Colter_Cook

- Apr 26, 2022
- 2 min read
Recently Keep Coyote Creek Beautiful partnered with the students of Yerba Buena High School to conduct a series of water quality tests on the section of Coyote Creek nearest to their school. As part of that project their teacher Dr. Rosemarie Calma had them write about their experience. Below we have the write up of Brandon, Anthony, Dana, Trang, Nam, and Priscilla.
Coyote Creek is the river that runs behind Yerba Buena Highschool. This ancient landmark continues to face environmental challenges such as climate change and pollution. In order to keep our waters healthy and running, we were tasked to find out the effects of all the environmental factors on the water. With help from Keep Coyote Creek Beautiful, our group members Brandon, Anthony, Dana, Trang, Nam, and Priscilla ran water quality tests.

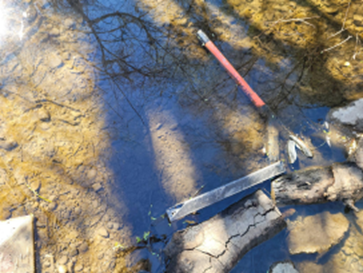

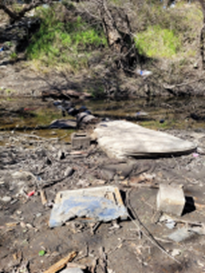
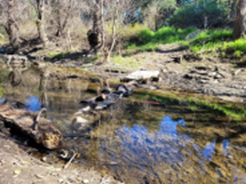
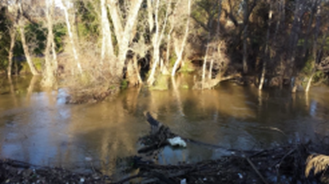
Pictures taken at Coyote Creek Sample Site
On February 22nd 2022, a representative from Keep Coyote Creek Beautiful named Mr. Colter Cook gave our class water samples from Coyote Creek. Our Marine Biology was divided into groups to experiment on the water. This way we could solidify our results. Mr. Colter provided us with air temperature (18.33℃), and the water temperature (12℃).

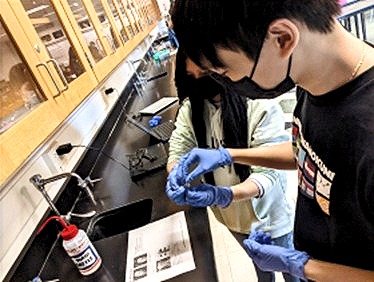

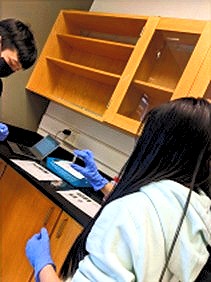
Students conducting tests.

We began by finding the turbidity [clarity] of the water by looking at a Secchi disk underneath the water sample. From our observation, we saw that it was very visible and we recorded 0 JTU [Jackson Turbidity Units, where a low number indicates clarity].

The data we collected next was the dissolved oxygen [amount of oxygen available to aquatic creatures]. To find this data, we had to put samples of water into small plastic test tubes. Afterward we added a dissolved oxygen test tablet and dissolved it to look at the color afterward. We found that the color-matched 4 parts per million (ppm) in all three trials and oxygen saturation was 40%.

In our next experiment, we tested for the salinity of the water. To do this, we cleaned and calibrated a refractometer to test our water sample three times. When looking through the refractometer, we saw that the salinity was 0/00 parts per thousand (ppt) all three times we tested it. We could tell this by seeing how far up the white went up the salinity chart.

The last experiment was to find the pH of the water sample [how acidic or basic]. Similar to finding dissolved oxygen, pH is found by putting tablets into a smaller sample of water in a test tube. After the tablet is dissolved, the color of the liquid will determine the pH amount. Compared to a pH chart, the pH we found was 7 since the color was yellow. With all of our results from our group, we then can compare them with results from other groups in the classroom.
Made possible by donations by City of San Jose ESD and EarthEcho.
Written by Brandon, Anthony, Dana, Trang, Nam, and Priscilla of YBHS
Edited by Colter Cook


Comments